With thanks to AMP Capital’s Chief Economist, Shane Oliver.
So, over the space of a few months, $1000 invested in the Australian share market had fallen in value to $500. Some lost their fortune. The 1987 share market crash – with the one day falls on 19 October in the US and 20 October in Australia and the peak being in August/September 1987 – have become a part of share market history along with events like the 1929 crash, the 1973-74 plunge and the GFC.
But each October (or starting in August), many have a certain apprehension about markets.
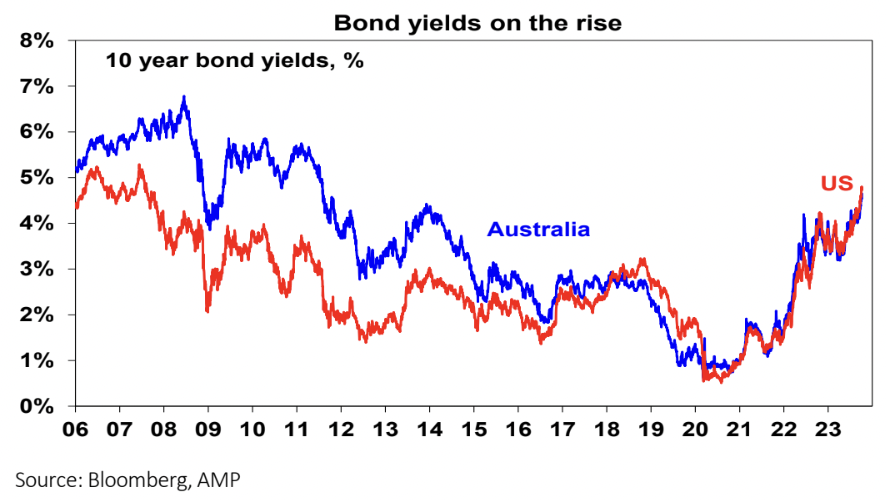
Rising bond yields

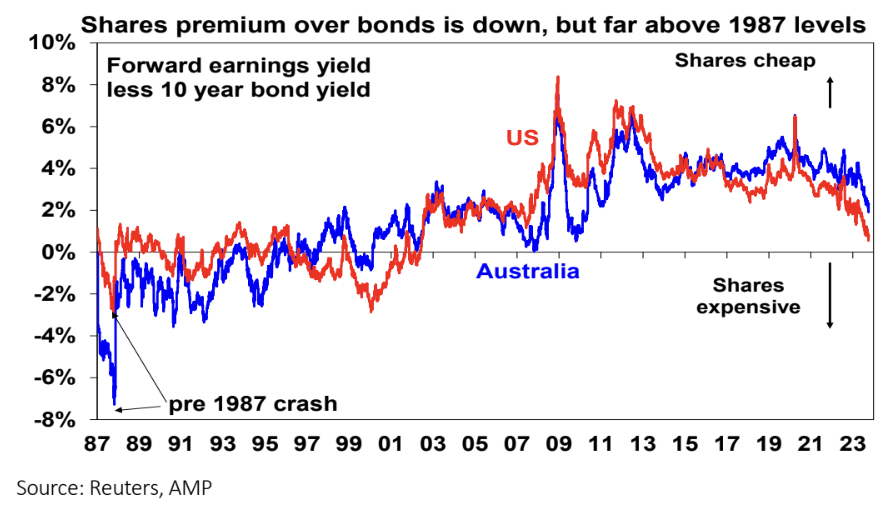
Now, the back up in bond yields this year – being based more on stronger than expected growth and hopes of a soft landing – is less threatening for shares than was the rise in bond yields into last year, which was more driven by rising inflation. But it’s still putting big pressure on share market valuations as highlighted by the deteriorating risk premium that shares offer over bonds.
This is proxied in the next chart by the earnings yield on shares (12 month ahead consensus earnings expectations divided by share prices) less the 10-year bond yield. It has fallen to its lowest in over 20 years in the US, and in Australia to its lowest since 2010.

- the still high risk of recession in the US;
- sluggish growth in China and worries about its property sector;
- messy US politics with Republicans beholden to a small group of fiscal conservatives seeing the removal of the House Speaker, a high risk of a government shutdown next month & uncertainty over fiscal policy;
- a surge in oil prices on the back of production cuts by Saudi Arabia and Russia, with fears this will be made worse by war in Israel.
1987 – what happened?
By 1987, this had become very speculative and debt fuelled with Australian shares nearly doubling over the year to their September 1987 high on the back of strong gains in so-called entrepreneurial stocks (e.g. Bond Corp and Qintex).
Shares peaked in August/September 1987 and after a gradual drift lower plunged on 19 and 20 October, resulting in an ultimate top to bottom fall of 35% in US shares and 50% in Australian shares. It took the US share market just over two years to rise above its pre-crash highs but Australian shares did not get there until February 1994.
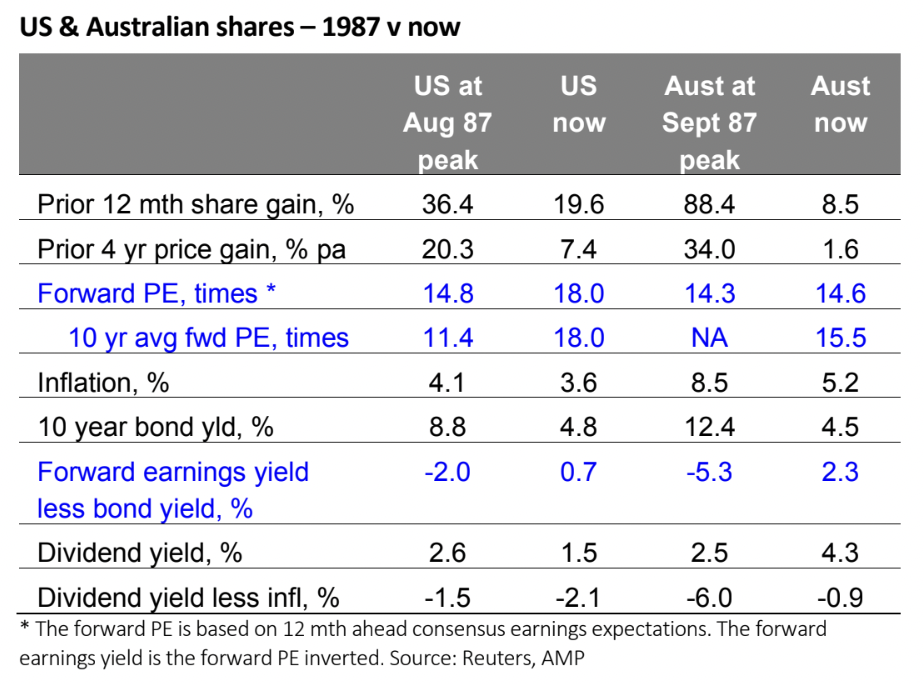
The following tables provide a comparison of key indicators for US and Australian shares today with those of 1987.

- Shares have seen far smaller increases compared to the run-up to the 1987 crash – there has been no 1987 style euphoria;
- Forward price to earnings ratios are higher than in 1987, particularly in the US, but inflation and bond yields are both lower such that the gap between forward earnings yields and bond yields is far more attractive than it was in 1987. See also the second chart in this note; and
- After the 1987 share market crash circuit breakers were built into the US stock market that close it down for a short period after a certain fall to help calm investors down.
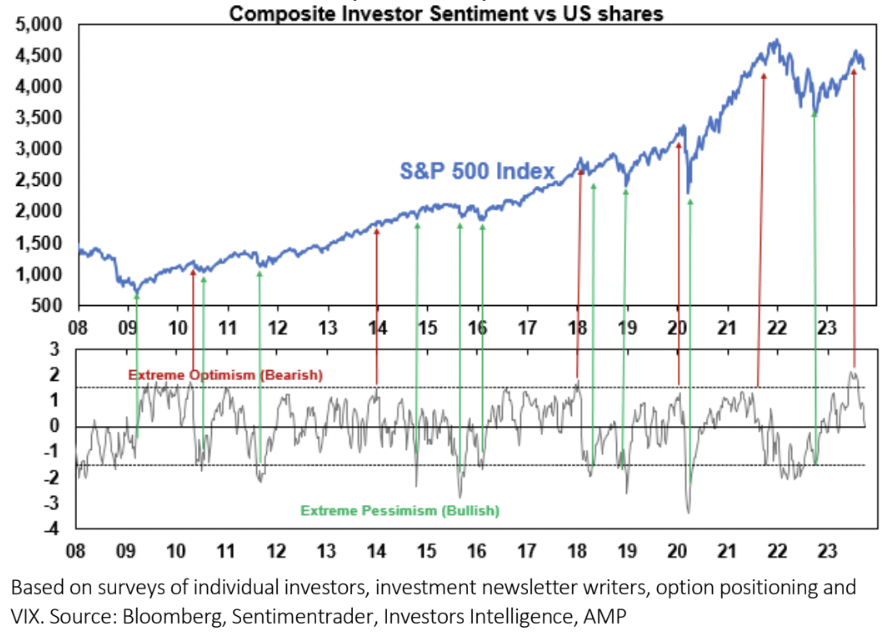
Investor sentiment has fallen sharply from the optimism seen mid-year when goldilocks was all the rage but it’s still not yet at the levels often associated with major market bottoms. See the next chart for the US. All of this suggests that the path of least resistance for shares may still be down in the short term. While valuations for the Australian share market are more attractive it would likely follow any further correction in US shares.

How serious is the threat from the war in Israel?
Today, other Arab countries are on the sidelines with many having better relations with Israel and oil demand is weakening. However, the main risk would come if Iran, which backs Hamas, is drawn into the conflict which could threaten its production, the flow of oil through the Strait of Hormuz (through which 20% of world oil consumption flows) or even Saudi production (as Iran did in 2019).
This time around, it’s very different – the reopening boost is behind us, monetary policy is tight and household budgets are under severe strain so the rise in petrol prices is more likely to act as a tax on spending.
Our estimate is that the average household weekly fuel bill is already up $12 since May. With stretched household budgets this means a further hit to consumer spending and less ability for companies to pass on price rises including from higher transport costs.
