This article has been re-produced with the kind permission of the Portfolio Construction Forum. The article is from Michael Mauboussin & Dan Callahan from Credit Suisse.
It is a detailed article but may help you understand yourselves better.
INTRODUCTION
In recent decades, psychologists and economists have cataloged the ways in which human behavior deviates from economic theory.¹ They have done this mostly through experiments and observation. Daniel Kahneman and Amos Tversky, psychologists who formalised this research, showed that individuals use heuristics, or rules of thumb, to make their judgments. These heuristics lead to biases when compared to normative economic behaviour.² For example, people generally place too much weight on information that is available to their minds, often associated with an event that is vivid or recent, and overestimate the probability of a similar event occurring again.
Neuroscientists have joined psychologists and economists to create the field of neuroeconomics. One of the goals of neuroeconomics is to understand how certain behaviors are linked to specific brain activity. The theory of modularity says that particular cognitive functions are associated with different parts of the brain. Neuroeconomics allows researchers to connect behaviors to specific regions, providing insight into how the brain handles certain cognitive challenges.
In this report, we examine four situations where individuals make poor choices and review the research to show where the brain makes those decisions. In each case, we present some ideas about how to overcome the potentially suboptimal choice.
MENTAL MISTAKE #1: SOCIAL CONFORMITY
In the summer of 2015, the CFA Institute surveyed 724 investors about which behavioral biases affect decision making the most.³ More than one-third of the investors voted for herding, or “being influenced by peers to follow trends.” Herding is problematic because an investor can’t beat his or her peers by doing the exact same thing that they are doing. Further, herding can lead to inefficient market prices.⁴
Humans are social beings, and conformity makes sense in a wide range of contexts. For example, you are well served to do what others are doing when they know more than you do. Conformity also encourages others to like you, which can confer loyalty and safety. Problems arise, however, when the group is wrong.
Solomon Asch conducted the most famous experiment of social conformity in the 1940s and 1950s.⁵ The researcher showed two cards to the subjects, who were in groups of seven to nine. One card had a single line on it and the other had three lines of varying lengths, including one of the same length as that on the first card (Figure 1). The task was to choose the line of the same length. Going around the room, the participants answered one after the other. The experiment opened uneventfully as the group selected with near perfect accuracy.
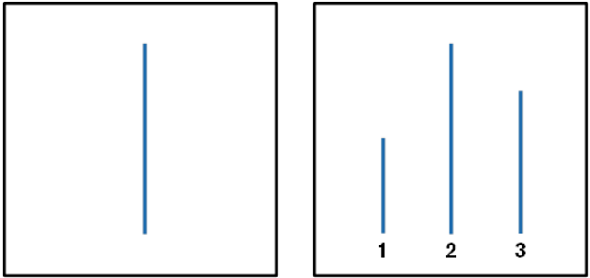
| Figure 1: Example of Line Matching from Solomon Asch’s Experiments
Source: Solomon E. Asch, “Opinions and Social Pressure,” Scientific American, Vol. 193, No. 5, November 1955, 31-35. |
||
The experiment then started for real. Asch had arranged for all of the members except one to be in with him on the experiment, making that individual the true subject. The researchers instructed the confederates, who answered publicly before the true subject, to give the wrong response in two-thirds of the trials. In a set of 123 experiments, the subjects conformed to the majority’s wrong answer 36.8% of the time. While about one-quarter of the subjects remained completely independent throughout the experiment, one-third aligned with the majority most of the time.Asch was fascinated by this degree of social conformity and interviewed the subjects immediately following the experiment. Based on their responses, he surmised that three “distortions” could explain the behavior of the conformers.⁶
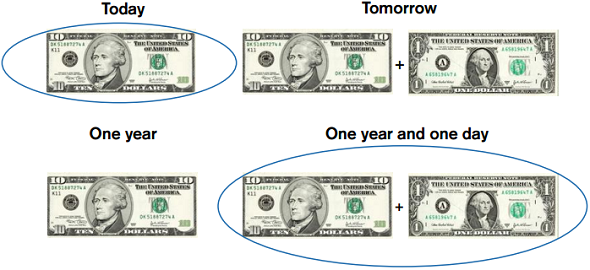
While Asch’s curiosity was laudable, interviews are not a rigorous way to determine the source of social conformity. In the mid-2000s, neuroscientists picked up where Asch left off. They were able to use functional magnetic resonance imaging (fMRI) technology to pinpoint the mechanisms of social conformity within the brain. First, scientists have been able to replicate Asch’s results consistently.⁷ Subjects conform not only for perceptual tasks, such as identifying line lengths, but also for subjective evaluations including judging the quality of paintings. There is even some evidence another species, chimpanzees, conforms. One of the earliest studies of social conformity using fMRI provided a startling result.⁸ Dr. Greg Berns and his colleagues, using a perceptual task, showed that social conformity is consistent with activity in the occipital and parietal lobes – visual processing regions associated with perception. More directly, the research suggests that the social setting alters what the subjects perceive. This is consistent with Asch’s distortion of perception. Further, those subjects who remained independent showed increased activity in the amygdala. This is a part of the brain that decodes emotion and is especially attuned to threats. Various stimuli trigger activity in the amygdala, but fear is the most effective. Staying independent creates an emotional burden and requires overcoming a wave of fear. Additional research supports the finding of Dr. Berns and his collaborators but overall the evidence remains tantalising but tenuous.⁹ Multiple studies show that social conformity is associated with activity in the posterior medial frontal cortex. This is the part of your brain that detects errors and interacts with other parts of the brain to correct the error.¹⁰ Your brain notices when the group provides an answer that is different from yours, and that disparity is unpleasant. For many, aligning with the group is more rewarding for the brain than being independent and correct. This research also provides some hints about how to avoid inappropriate conformity. The studies, starting with Asch, show that having someone in the group with the same view as you substantially reduces the pull of conformity. Seek others who are like-minded if you feel as if everyone has a point of view that is both different from yours and wrong. Perhaps the best advice comes from the father of security analysis, Benjamin Graham. He said, “Have the courage of your knowledge and experience. If you have formed a conclusion from the facts and if you know your judgment is sound, act on it – even though others may hesitate or differ. (You are neither right nor wrong because the crowd disagrees with you. You are right because your data and reasoning are right.)” ¹¹ MENTAL MISTAKE #2: PATTERN SEEKING Humans are natural pattern seekers. This ability has conferred an advantage to Homo sapiens throughout our history. But problems arise when we perceive patterns where none exist, more formally what statisticians call Type I error. Research shows that our desire to discern patterns, even when they are an incorrect assessment of cause and effect, has contributed to our evolutionary success. Essentially, evolution forgives lots of Type I errors as long as the occasional correct assessment carries a sufficiently large benefit.¹² The use of a chart to divine a stock’s next move is a good example of pattern seeking.¹³ While there may be value in technical analysis, there is not much in the way that most investors use past prices to understand the future. We are naturally drawn to imposing order, even to cases where the underlying processes are random. Neuroscientists have created some ingenious experiments to figure out what part of our brain is determined to see patterns. But before we get to humans, let’s start with pigeons. Scientists set up a box with two keys that a pigeon can peck with payoffs that are random. They then make one key much more attractive than the other – for example, the red key provides food with an 80% probability and the white key with a 20% probability (1 – .80). How will the pigeons choose? Once the pigeons figure out the relative probabilities, they maximise their payoff by hitting the red key almost every time. Rats do this as well, as do children under the age of four.¹⁴ If the total possible payoff is 100, this strategy yields 80 ([1.0 * 80] + [0.0 * 20]), and there is no strategy that can yield more. Humans, on the other hand, tend follow a strategy called “frequency matching.” After ascertaining the probabilities, humans alternate between the red and white keys in an attempt to anticipate what will happen next. They seek a pattern. They do guess red 80% of the time, matching the frequency of the payoffs, but still try to anticipate the rewards even when they know the occurrences are random. This strategy has a total payoff of just 68 ([0.8 * 80] + [0.2 * 20]). From kindergarten on, humans are frequency matchers. In recent decades, neuroscientists have been able to figure out where this process happens in the brain through the study of split-brain patients. These are people who have surgery to sever the bundle of nerves between the two hemispheres of the brain to treat epilepsy. The surgery alleviates the symptoms of the disease and also allows scientists to determine which part of the brain handles various tasks. Specifically, experiments with the split-brain patients allowed researchers to discern where the tendency to search for patterns resides. The right hemisphere is good at some tasks, including facial recognition, but is poor at making inferences. It tends to be literal. The left hemisphere, where language largely resides, is also good at inventing stories to fit facts – indeed, it may be too good at it. When the scientists presented a version of the probability guessing experiment to the right hemisphere, they found that it maximised just as the pigeons, rats, and little kids did. But when they did the same experiment with the left hemisphere, they found it attempted to match frequency.¹⁵ The left hemisphere is the part of your brain responsible for finding patterns. The scientists conclude “that the left hemisphere does this even when it can be nonadaptive.”¹⁶ One investor behavior that appears consistent with pattern seeking is called the dumb money effect, where investors “tend to transfer money from funds with low recent returns to funds with high recent returns.”¹⁷ On average, investors in mutual funds earn 1.5 percentage points less per year than a buy-and-hold strategy as a result of the dumb money effect. The effect is even larger, 3 to 7 percentage points, in hedge funds.¹⁸ So it’s crucial to be aware that part of your brain is seeking patterns and will see them even when they don’t exist. Distinguish between realms where patterns are likely to be useful and where they are generally illusory. The behavior of investors and executives suggests that they believe they see dependable patterns even in cases when those patterns don’t exist. MENTAL MISTAKE #3: HYPERBOLIC DISCOUNTING – PREFERRING A SMALL GAIN TODAY TO A LARGER GAIN TOMORROW Here’s a quiz for you – Which would you prefer, $10 today or $11 tomorrow? How about a choice between $10 one year from now and $11 in one year and a day? When researchers ask these questions, subjects generally prefer the lower amount now (“I’ll take the $10 today”) and the higher amount in the future (“I’ll pick the $11 in a year and a day”). Figure 2 shows this reversal in preference.
|
||
| Figure 2: Subjects Opt for a Smaller Reward Today and a Larger Reward in the Future
Source: Shane Frederick, George Loewenstein, and Ted O’Donoghue, “Time Discounting and Time Preference: A Critical Review,” Journal of Economic Literature, Vol. 40, No. 2, June 2002, 351-401. |
||
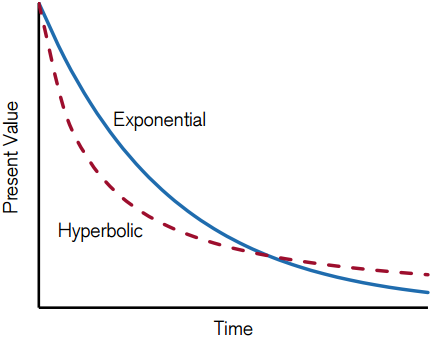
| This pattern of preference runs counter to the discounted utility model, which says we can translate choices from the present to the future, and back again, using a single discount rate. For example, if your annual discount rate is 8%, you are equally happy to receive $100 today or $108 one year from now. While economists have known all along that people don’t behave this way, it has become the standard in economic theory. This is called exponential discounting.¹⁹Economists and psychologists can use the answers of their subjects to impute the discount rates that are consistent with their choices. If you prefer $10 today to $11 in one week, your implied annual discount rate is really high. If you prefer $11 in a year and a day to $10 in a year, your discount rate is much lower. The pattern of high implied discount rates in the short term and low discount rates in the long term is called hyperbolic discounting.²⁰ Figure 3 shows how the present values differ for the same stream of cash.
|
||
| Figure 3: Hyperbolic versus Exponential Discounting
Source: Discount rates based on Leonard Green and Joel Myerson, “Exponential Versus Hyperbolic Discounting of Delayed Outcomes: Risk and Waiting Time,” American Zoologist, Vol. 36, No. 4, September 1996, 496-505. |
||
| The distinction between exponential and hyperbolic discounting may appear to be the purview of nerdy professors, but it actually has some important practical implications.We can start with a commonplace example – a diet. Most of us decide at some point that it would be healthy to shed some weight. And most of us choose to eat a delicious dessert today and resolve to start the diet tomorrow. If this sounds familiar, you are not alone.
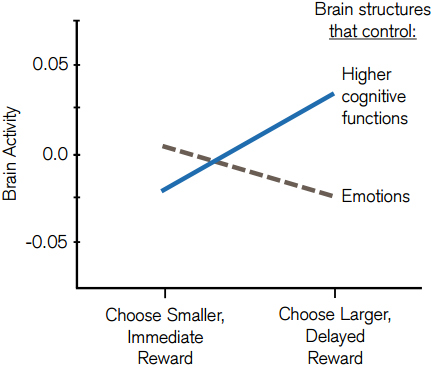
Here’s a case in point. Researchers were interested in the choices people make for their snacks. The subjects have a healthy choice, a piece of fruit, and an unhealthy choice, either a chocolate bar or a salty snack. A consistent pattern emerges. When the scientists ask the subjects what they want now, they pick the unhealthy snack 70% of the time. But when the subjects are asked about a snack for next week, they select the healthy one 74% of the time. We insist that our future selves will be good even as our present selves enjoy the chocolate.²¹ Considering which discount rate to apply also has major implications for policy decisions. For instance, economists have come to very different conclusions about the cost of climate change, and hence the immediate action necessary, based on the discount rate they assume. A low discount rate implies a high cost and a higher discount rate suggests a lower cost. Two economists who agree on the costs and risks of climate change might come to very different conclusions about necessary policy based solely on the interest rate assumption.²² Finally, many individuals make financial decisions that are not optimal. One illustration is the age at which US citizens should claim Social Security benefits. Full retirement age is 66 or 67 years old, but the age for early eligibility is 62 years old. Those who claim early receive a smaller monthly sum than those who wait until the full retirement age. For example, someone who is set to receive $1,000 per month at the full retirement age collects $750 if they start payments at age 62 and $1,320 if they delay until age 70.²³ While the payment structures are designed to give comparable payoffs based on life expectancies, economists advise that it is in almost everyone’s interest to delay claims as long as possible. Indeed, waiting until age 70 is the best strategy for many.²⁴ But this is not what Americans do. About 40% claim benefits at the early eligibility age, and the vast majority claim at or before the full retirement age. Similar behavior appears when people are offered lump sums versus annuities. As part of the downsizing of the US military in the early 1990s, the Department of Defense offered severance packages to 65,000 military personnel. They could choose between a lump sum or an annuity that was worth considerably more. A small majority of the officers selected the lump sum and virtually all of the enlisted personnel did. For both groups, the value of the annuity was approximately 80% higher than the lump sum.²⁵ Researchers set out to figure out what was going on as the brain decided between an immediate and a distant payoff. It turns out that different parts of the brain mediate each decision (Figure 4). When the choice was for a smaller but immediate reward ($10 today versus $11 tomorrow) the limbic structures were in control. This part of the brain is associated with impulsive behavior and dysfunctions, including drug addiction. When larger but delayed rewards are involved ($10 in a year versus $11 in a year and a day) areas of the prefrontal and parietal cortex are active. These areas are associated with deliberative processes and cognitive control.²⁶ So, it appears that based on the type of problem, distinct neural systems handle the solution. This is relevant for a host of issues, including drug addiction, dieting, and saving enough for retirement. For investors, there are a few ways to deal with the preference for payoffs in the present. One way is to create default decisions, so the issue does not even come up. For instance, you may elect to dedicate all pay raises to savings, so you will never be tempted to spend the money today. This method doesn’t allow your brain to deal with the problem at all and goes directly to a beneficial solution.
|
||
| Figure 4: Different Parts of the Brain Mediate Short- and Long-Term Decisions
Source: Samuel M. McClure, David I. Laibson, George Loewenstein, and Jonathan D. Cohen, “Separate Neural Systems Value Immediate and Delayed Monetary Rewards,” Science, Vol. 306, No. 5695, October 15, 2004, 503-507. |
||
| Scientists have also played with means to make our future selves concrete in our minds.²⁷ One way to do this is to use software to create an avatar. This allows a 25-year-old to see, virtually, a 65-year-old version of herself. A glimpse of the future can encourage activity in the planning part of the brain, avoiding the limbic system, and can therefore lead to better outcomes.
MENTAL MISTAKE #4: LOSS AVERSION AND FINANCIAL DECISIONS One of the main ideas from prospect theory is loss aversion, the idea that people suffer more from losses than they enjoy comparable gains. Prospect theory was developed by Kahneman and Tversky to explain how individuals actually behave when faced with risky choices.²⁸ The loss aversion coefficient is about two, which means that the unhappiness of a $1 loss is twice as large as the happiness of a $1 gain. So if you offer a proposition where a correct call of a coin toss pays $300 and an incorrect call costs $200, most people will turn it down. Although the expected value is $50 ([.50 x $300] + [.50 x -$200]) the ratio of gain to loss, 1.5, is too low for most people to play. The average coefficient of two, however, belies that there is a wide distribution across the population. Some people are highly loss averse, others less so. Women tend to be somewhat more loss averse than men, and the old are more loss averse than the young.²⁹ But perhaps the most important issue is that our loss aversion coefficient changes based on experience. For example, seasoned market participants have lower loss aversion coefficients because they ultimately have to make money. But if you have been stung with losses recently, you will tend to avoid risk. One of the puzzles in finance is why the equity risk premium – the extra return that investors in equities earn to compensate them for owning risky stocks versus less-risky bonds – has historically been so high. Researchers found that equity returns were higher than they should have been given the actual amount of risk.³⁰ Two behavioral economists, Shlomo Benartzi and Richard Thaler, offer a solution to the puzzle through what they call “myopic loss aversion”.³¹ Look at the market over rolling 10- or 20-year periods and you almost always see gains. But in the short run, there are lots of ups and downs. So how frequently you check your stock portfolio determines the probability that you will see gains or losses. The basic idea of myopic loss aversion is that if you examine your portfolio often, you are more likely to see losses. Being loss averse, you will insist on higher returns to compensate for your suffering. However, if you check your portfolio infrequently, you are more likely to see gains and hence will not require returns as high. They found that the evaluation period consistent with the equity risk premium to that time was about one year. Benartzi and Thaler’s answer to the puzzle is that since people check their portfolios pretty often (myopic) they suffer (loss aversion) and hence demand a high premium. But in markets, it is often the case that expected returns go up as prices go down and expected returns go down when markets are up. So we end up being conservative when we should be aggressive and aggressive when we should be conservative. All of this raises an obvious question – how would we invest if we were immune to loss aversion? Researchers created a clever experiment to test the proposition. The subjects in the experiment were endowed with $20 and told that they would play several rounds of an investment game. In each round, the subject could either invest, or not invest, one dollar. If they invested, they handed their dollar to the researcher who then flipped a fair coin in full view of the subject. If it landed on heads, the subject lost their money. If it landed on tails, they won $2.50. If they did not invest, they kept their dollar for that round and went on to the next one. The experiment lasted for 20 rounds, and the subjects were paid the money based on the results. Participants included normal people recruited from the local community and patients with brain damage stemming from stroke, surgery, or disease. The patients had ordinary intelligence, but the brain damage had affected their ability to process emotion. So these people could do basic maths but do not feel emotion the way most people do. It is easy to see that the best strategy in this investing game is to hand your dollar to the researcher every time, as the expected value for each round is $1.25 ([.50 x $2.50] + [.50 x $0]). In fact, if you played every round there is only about a 1-in-8 chance of having less money than you started with, and the expected value is $25. However, keeping your dollar does prevent you from losing in any particular round. The brain-damaged patients finished with $25.70 on average, 13% more than the $22.80 the normal people earned. They ended with more money because they played 45% more rounds than the normal people did, including twice as many rounds after having suffered a loss.³² It is hard to know exactly what the normal people were thinking, but one plausible explanation is that when they lost, they preferred the sure dollar in the next round to the risk of another loss. In other words, their loss aversion caused them to willfully give up a positive net present value proposition. The main lesson from this experiment is to try to keep in check the effect of loss aversion. Some traders deal with loss aversion by quickly selling losers.³³ Others focus on finding investments with attractive risk and reward characteristics and don’t let past outcomes shape present decisions. This is easier said than done. A final strategy picks up on Benartzi and Thaler’s work on myopic loss aversion and suggests that you lengthen the evaluation period you use for your investments, thus mostly sidestepping loss aversion.
CONCLUSION In recent decades, psychologists, economists, and neuroscientists have worked together to understand how our behaviors depart from the standards of normative economic theory and why exactly we have a proclivity to do so. Scientists now have technology to observe brains of individuals as they decide and have crafted experiments to compare behaviors of people with normally functioning brains with those who had their brains altered through stroke, surgery, or disease. This research has lifted the veil on the mental processes behind our choices. Some of the findings include:
The challenge now is to create processes and procedures that manage or mitigate the biases that arise from these tendencies.
ENDNOTES 1. Richard H. Thaler, Misbehaving: The Making of Behavioral Economics (New York: W.W. Norton & Company, 2015). 2. Daniel Kahneman, Paul Slovic, and Amos Tversky, Judgment Under Uncertainty: Heuristics and Biases (Cambridge, UK: Cambridge University Press, 1982). 3. Shreenivas Kunte, “The Herding Mentality: Behavioral Finance and Investor Biases,” Enterprising Investor, August 6, 2015. See https://blogs.cfainstitute.org/investor/2015/08/06/the-herding-mentality-behavioral-finance-and-investor-biases/. 4. See Ivo Welch, “Herding among Security Analysts,” Journal of Financial Economics, Vol. 58, No. 3, December 2000, 369-396. Also, Chia-Hsuan Yeh and Shu-Heng Chen, “Market Diversity and Market Efficiency: The Approach Based on Genetic Programming,” AISB Journal, Vol. 1, No. 1, December 2001, 147-167. 5. Solomon E. Asch, “Opinions and Social Pressure,” Scientific American, Vol. 193, No. 5, November 1955, 31-35. 6. S.E. Asch, “Effects of Group Pressure Upon the Modification and Distortion of Judgments,” in Harold Guetzkow, ed., Groups, Leadership and Men (Pittsburgh, PA: Carnegie University Press, 1951). 7. Robert Schnuerch and Henning Gibbons, “A Review of Neurocognitive Mechanisms of Social Conformity,” Social Psychology, Vol. 45, No. 6, November 2014, 466-478. 8. Gregory S. Berns, Jonathan Chappelow, Caroline F. Zink, Giuseppe Pagnoni, Megan E. Martin-Skurski, and Jim Richards, “Neurobiological Correlates of Social Conformity and Independence During Mental Rotation,” Biological Psychiatry, June 22, 2005. See http://www.ccnl.emory.edu/greg/Berns Conformity final printed.pdf. Also, Gregory Berns, Iconoclast: A Neuroscientist Reveals How to Think Differently (Boston, MA: Harvard Business Press, 2008), 92-97. For a popular account, see Sandra Blakeslee, “What Other People Say May Change What You See,” The New York Times, June 28, 2005. 9. Sina Alexa Trautmann-Lengsfeld, Christoph Siegfried Herrmann, “EEG Reveals an Early Influence of Social Conformity on Visual Processing in Group Pressure Situations,” Social Neuroscience, Vol. 8, No. 1, January 2013, 75-89. 10. Claudia Danielmeier, Tom Eichele, Birte U. Forstmann, Marc Tittgemeyer, and Markus Ullsperger, “Posterior Medial Frontal Cortex Activity Predicts Post-Error Adaptations in Task-Related Visual and Motor Areas,” Journal of Neuroscience, Vol. 31, No. 5, February 2, 2011, 1780-1789. 11. Benjamin Graham, The Intelligent Investor: A Book of Practical Counsel, Fourth Revised Edition (New York: Harper & Row, 1973), 287. 12. Kevin R. Foster and Hanna Kokko, “The Evolution of Superstitious and Superstition-Like Behaviour,” Proceedings of the Royal Society B, Vol. 276, No. 1654, January 2009, 31-37. 13. Jason Zweig, Your Money & Your Brain: How the New Science of Neuroeconomics Can Help Make You Rich (New York: Simon & Schuster, 2007). 14. John M. Hinson and J. E. R. Staddon, “Matching, Maximizing, and Hill-Climbing,” Journal of the Experimental Analysis of Behavior, Vol. 40, No. 3, November 1983, 321-331. Also, Peter L. Derks and Marianne I. Paclisanu, “Simple Strategies in Binary Prediction by Children and Adults,” Journal of Experimental Psychology, Vol. 73, No. 2, February 1967, 278-285. Here’s a bonus for you endnote readers: It turns out that pigeons are also better than humans at replying to the “Monty Hall Dilemma.” The birds approximated the optimal strategy while humans failed to do so. See Walter T. Herbranson and Julia Schroeder, “Are Birds Smarter Than Mathematicians? Pigeons (Columba livia) Perform Optimally on a Version of the Monty Hall Dilemma,” Journal of Comparative Psychology, Vol. 124, No. 1, February 2010, 1-13. 15. The research is not quite so bold. When the subjects saw words come on the screen, the right hemisphere maximised and the left hemisphere frequency matched. But when the subjects saw faces, which is the strength of the right hemisphere, the results flipped: the right hemisphere frequency matched and the left hemisphere maximised. See Michael S. Gazzaniga, Tales from Both Sides of the Brain: A Life in Neuroscience (New York: Ecco, 2015), 294-296. 16. George Wolford, Michael B. Miller, and Michael Gazzaniga, “The Left Hemisphere’s Role in Hypothesis Formation,”Journal of Neuroscience, Vol. 20, No. 6, March 2000, RC64, 1-4. Also, Michael S. Gazzaniga, Who’s In Charge? Free Will and the Science of the Brain (New York: Ecco, 2011), 84-85. 17. Andrea Frazzini and Owen A. Lamont, “Dumb Money: Mutual Fund Flows and the Cross-Section of Stock Returns,” NBER Working Paper No. 11526, July 2005. For a final version of the paper, see Andrea Frazzini and Owen A. Lamont, “Dumb Money: Mutual Fund Flows and the Cross-Section of Stock Returns,” Journal of Financial Economics, Vol. 88, No. 2, May 2008, 299-322. 18. Ilia D. Dichev, “What Are Stock Investors’ Actual Historical Returns? Evidence from Dollar-Weighted Returns,”American Economic Review, Vol. 97, No. 1, March 2007, 386-401. Also Ilia D. Dichev and Gwen Yu, “Higher Risk, Lower Returns: What Hedge Fund Investors Really Earn,” Journal of Financial Economics, Vol. 100, No. 2, May 2011, 248-263. 19. Paul A. Samuelson, “A Note on Measurement of Utility,” Review of Economic Studies, Vol. 4, No. 2, February 1937, 155-161. 20. Shane Frederick, George Loewenstein, and Ted O’Donoghue, “Time Discounting and Time Preference: A Critical Review,” Journal of Economic Literature, Vol. 40, No. 2, June 2002, 351-401. Also David Laibson, “Golden Eggs and Hyperbolic Discounting,” Quarterly Journal of Economics, Vol. 112, No. 2, May 1997, 443-477. Many economists now use the term “quasi-hyperbolic discounting” because it is a model that better fits the facts. But the basic idea is the same. 21. Daniel Read and Barbara van Leeuwen, “Predicting Hunger: The Effects of Appetite and Delay on Choice,”Organizational Behavior and Human Decision Processes, Vol. 76, No. 2, November 1998, 189-205. 22. William Nordhaus, “Critical Assumptions in the Stern Review on Climate Change,” Science, Vol. 317, No. 5835, July 13, 2007, 201-202; Richard A. Posner, Catastrophe: Risk and Response (Oxford, UK: Oxford University Press, 2004), 150-155. 23. This example applies to people born between the years 1943-1954. See Melissa A. Z. Knoll and Anya Olsen, “Incentivizing Delayed Claiming of Social Security Retirement Benefits Before Reaching the Full Retirement Age,” Social Security Bulletin, Vol. 74, No. 4, 2014. 24. John B. Shoven and Sita N. Slavov, “Efficient Retirement Design: Combining Private Assets and Social Security to Maximize Retirement Resources,” Shoven-Slavov Retirement Booklet, March 2013. See http://siepr.stanford.edu/system/files/shared/documents/Efficient_Retirement_Design-March_2013b.pdf. 25. John T. Warner and Saul Pleeter, “The Personal Discount Rate: Evidence from Military Downsizing Programs,”American Economic Review, Vol. 91, No. 1, March 2001, 33-53. 26. Samuel M. McClure, David I. Laibson, George Loewenstein, and Jonathan D. Cohen, “Separate Neural Systems Value Immediate and Delayed Monetary Rewards,” Science, Vol. 306, No. 5695, October 15, 2004, 503-507. Also, Samuel M. McClure, Keith M. Ericson, David I. Laibson, George Loewenstein, and Jonathan D. Cohen, “Time Discounting for Primary Rewards,” Journal of Neuroscience, Vol. 27, No. 21, May 23, 2007, 5796-5804. 27. Jason Zweig, “Meet ‘Future You.’ Like What You See? New ‘Virtual Reality’ Techniques Could Help Solve The Age-Old Problem of Saving for Retirement,” Wall Street Journal, March 26, 2011. 28. Daniel Kahneman and Amos Tverky, “Choices, Values, and Frames,” American Psychologist, Vol. 39, No. 4, April 1984, 341-350. 29. Eric J. Johnson, Simon Gächter, Andreas Herrmann, “Exploring the Nature of Loss Aversion,” IZA DP No. 2015, March 2006. Also, David J. Paulsen, Michael L. Platt, Scott A. Huettel, and Elizabeth M. Brannon, “From Risk-Seeking to Risk-Averse: The Development of Economic Risk Preference from Childhood to Adulthood,” Frontiers in Psychology, Vol. 3, No. 313, September 2012. 30. Rajnish Mehra and Edward C. Prescott, “The Equity Premium: A Puzzle,” Journal of Monetary Economics, Vol. 15, No. 2, March 1985, 145-161. 31. Shlomo Benartzi and Richard H. Thaler, “Myopic Loss Aversion and the Equity Premium Puzzle,” Quarterly Journal of Economics, Vol. 110, No. 1, February 1995, 73-92. Also, Richard Thaler, Amos Tversky, Daniel Kahneman, and Alan Schwartz, “The Effect of Myopia and Loss Aversion on Risk Taking: An Experimental Test,” Quarterly Journal of Economics, Vol. 112, No. 2, May 1997, 647-661. 32. Baba Shiv, George Loewenstein, Antoine Bechara, Hanna Damasio, and Antonio R. Damasio, “Investment Behavior and the Negative Side of Emotion,” Psychological Science, Vol. 16, No. 6, June 2005, 435-439. 33. Curtis M. Faith, Way of the Turtle: The Secret Methods that Turned Ordinary People into Legendary Traders (New York: McGraw-Hill, 2007). |
||